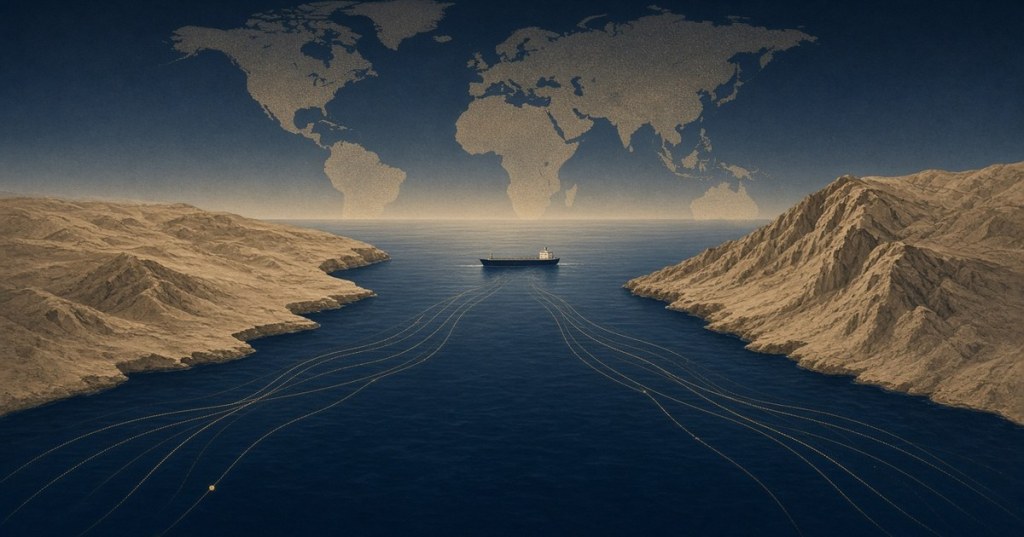
A practical framework for understanding how energy and shipping shocks can affect purchasing power—and why long-term asset strategy may need to change.
Byline: Cross Border Money Lab Editorial Team
Why This Matters
A disruption in the Strait of Hormuz does not remain an energy-market event. When oil, LNG, shipping and fertiliser become scarcer, slower or more expensive, those costs can travel into transport, manufacturing, food prices, currencies and the purchasing power of ordinary savings.
The visible story is a chokepoint. The incomplete reading is that the oil print is the whole story, or that an energy-exporting region is automatically protected at household level. Import dependence, the currency of the energy bill, and policy choices mean the same shock can land differently in the Middle East, Europe, Asia and Latin America.
If that spread is missed, a household can keep a nominal cash or asset number while losing command over goods. This article explains how the disruption can feed into inflation, where regional outcomes diverge, and why it is more useful to think in asset roles than to hunt for one inflation hedge. The deeper question is whether an asset structure built for cheaper energy and fading inflation is prepared for a more inflation-sensitive environment.
Key Points
- The Strait of Hormuz is a transmission point for energy, LNG, shipping and fertiliser, not only a headline about barrels.
- Higher energy and freight costs can pass through transport, production, food and services into inflation, with lags and policy offsets.
- Regional outcomes differ. Import dependence, currencies and policy responses matter more than a single global score.
- Purchasing-power loss, currency depreciation and asset-price decline are different problems. They can arrive together without being the same thing.
- Inflation resilience is a mix of asset roles—not a search for one perfect hedge, a complete gold portfolio, or a proven Bitcoin equivalent.
A disruption in the Strait of Hormuz does not begin as an inflation story. It begins as a shipping story: tankers, insurance premia, delayed loadings, and the cost of moving oil, gas and fertiliser through a passage that, at its narrowest, is only 29 nautical miles wide.
Those costs do not stay in the energy market. They can travel into transport, manufacturing, food prices, interest rates, currencies and the purchasing power of savings.
The waterway is not a sealed door. Reuters reported on 21 September 2026 that 17 trackable commodity vessels transited over one weekend, down from 37 trackable weekend transits a week earlier, while some producers continued to move oil with transponders switched off. Those are weekend totals, not daily counts. Separately, Reuters reported that before 28 February 2026 the strait typically handled about 125 large commercial vessels a day. The IEA still describes that conflict as the largest supply disruption in the history of the global oil market. Cargo can move, and still be scarcer, slower and more expensive.
That distinction matters for money. An asset structure built for cheaper energy, reliable trade routes and fading inflation may preserve a nominal balance while losing real spending power.
The useful question is not where oil trades next week. It is whether yesterday’s mix of cash, bonds, equities, property, gold and other holdings was designed for conditions that may no longer hold.
Why Hormuz matters beyond the Middle East
The IEA’s Strait of Hormuz factsheet, last updated in February 2026, records that an average of 20 million barrels a day of crude oil and oil products transited the strait in 2025—about 25% of world seaborne oil trade. Around 80% of that oil was destined for Asia. Crude alone was nearly 15 million barrels a day, close to 34% of global crude trade. China and India together received 44% of those crude exports.
Only Saudi Arabia and the UAE have operational crude pipelines that can reroute meaningful volumes around the strait. The IEA estimates 3.5 to 5.5 million barrels a day of available bypass capacity, mainly via Saudi Arabia’s East-West system to Yanbu and the UAE’s line to Fujairah. Iraq, Kuwait, Qatar, Bahrain and Iran still depend on the waterway for the bulk of their oil exports. That buffer is not a guaranteed spare tank. Reuters reported on 21 September 2026 that attacks on the East-West pipeline had prompted Saudi Arabia to raise Hormuz loadings, with no visible oil loadings from Yanbu since 16 September.
The gas channel is narrower still. In 2025, just over 112 billion cubic metres of LNG transited the strait—almost 20% of global LNG trade. About 93% of Qatar’s and 96% of the UAE’s LNG exports used that route. There is no alternative seaborne path for those cargoes. Almost 90% of the LNG leaving via Hormuz went to Asia, covering around 27% of Asia’s LNG imports; Europe took just over 10%, or about 7% of its LNG inflows. Bangladesh, India and Pakistan imported almost two-thirds of their LNG through the strait in 2025.
Fertiliser is part of the same corridor. The IEA reports that more than 30% of global urea trade, and about 20% of ammonia and phosphate trade, moves through the strait. Gulf smelters ship around 5 million tonnes of aluminium a year through the same passage—about 8% of global supply. Around half of global seaborne sulphur trade uses it too.
How an oil shock becomes inflation
The transmission is a chain, not a switch.
Hormuz disruption can constrain or raise the cost of moving oil, LNG, refined products and fertiliser. Higher bunker fuel, freight and war-risk insurance then lift the cost of transport, electricity, farm inputs and factory output. Those costs can feed into food, goods and services. Households feel weaker purchasing power. Central banks and currencies may respond, sometimes after a lag.
None of this happens automatically or equally. Firms may absorb part of the shock in margins. Governments may use subsidies, price controls or strategic stocks. A stronger currency can blunt imported inflation; a weaker one can amplify it. The IEA’s 11 March 2026 decision to make 400 million barrels of emergency stocks available is an example of a policy offset, not a proof that prices stay still.
The World Bank’s April 2026 Commodity Markets Outlook treats the first-round commodity spike as observed and the later inflation path as a forecast. Its baseline assumed the most acute disruptions would fade, with Brent averaging $86 a barrel in 2026, against $69 in 2025, energy prices up 24%, and overall commodity prices up 16%. Under that baseline, inflation in emerging-market and developing economies was projected at 5.1% in 2026, after 4.7% in 2025. A more severe scenario put Brent as high as $115 and developing-economy inflation as high as 5.8%. Those figures are staff projections, not observed year-end outcomes. As of late September, Reuters still described Hormuz traffic as a trickle, so the April assumption that shipping would recover through 2026 remains a forecast, not a settled fact.
The same report’s special focus adds historical evidence rather than a 2026 measurement: during periods of surging geopolitical risk, a 1% reduction in oil production has, on average, been associated with a peak oil-price increase of about 11.5%. A geopolitically driven 10% oil-price increase has historically been followed by natural-gas price increases peaking around 7% and fertiliser price increases peaking above 5%, typically about a year after the oil shock. That lag is one reason a shipping event in spring can still be an inflation story later in the year.
UNCTAD’s June 2026 monitor frames a further scenario: if refined-oil prices were 50% higher and import volumes stayed at 2024 levels, the annual net oil-import bill of 65 vulnerable oil-importing economies could rise by more than $20 billion. That is a modelled cost, not a measured invoice.
How a Hormuz shock can travel into purchasing power
A possible transmission chain, not an automatic sequence. Effects vary by country, policy and time lag.
1. Hormuz disruption
Shipping, loadings and route risk
2. Oil, LNG, shipping and insurance costs
Energy and freight become more expensive
3. Transport, electricity, fertiliser and production
Input costs rise across the real economy
4. Food, goods and services
Household prices can follow, with a lag
5. Inflation, currency and interest-rate responses
Policy and exchange rates may amplify or blunt the hit
6. Purchasing-power pressure
The same cash buys less of the household basket
Why the impact differs by region
A chokepoint shock is global in price and local in burden. The comparison below is a map of channels, not a ranking of countries.
Middle East and GCC
Main exposure: Imported food and goods, freight, aviation, and household costs even where the state exports energy
Transmission channel: Energy, shipping, and a dual-price system of export receipts versus consumer prices
Mitigating factor: Fiscal buffers and, in some states, domestic energy subsidies
Why outcomes differ: Production damage, subsidy design, and the import share of the household basket
Europe
Main exposure: Imported energy and refined products, then wages and services
Transmission channel: Fuel and input costs feeding inflation, growth and interest-rate trade-offs
Mitigating factor: Gas storage, alternative suppliers and demand reduction
Why outcomes differ: Industrial mix, remaining pipeline options, and fiscal space for targeted support
Asia
Main exposure: Hormuz-linked crude, LNG and product import bills
Transmission channel: Dollar energy invoices, manufacturing, aviation, logistics and currencies
Mitigating factor: Strategic stocks, term LNG contracts, and domestic coal or renewables in some countries
Why outcomes differ: Importer versus producer status, and how much of the energy bill is dollar-priced
Latin America
Main exposure: A split between energy exporters and energy/food importers, including tourism-dependent Caribbean economies
Transmission channel: Terms of trade, then fuel, food and transport prices
Mitigating factor: Oil-export windfalls where shipments continue; renewable power in some Central American systems
Why outcomes differ: Net oil position, debt, reserves and subsidy design. Inflation can still rise even where growth improves
Middle East and GCC
Energy exporters are not automatically protected at household level. A government can earn more from a barrel and still import a large share of its food, vehicles, medicines and consumer goods. Shipping, aviation and construction costs rise with bunker fuel and delayed cargo. Employment and business budgets can tighten even where headline export receipts look stronger, especially if production or transit itself is disrupted.
The IMF’s March 2026 analysis described a large, sudden tax on income for fuel-importing economies, while also noting damaged infrastructure, tourism losses and tighter financing in parts of the Middle East. Its April follow-up added that countries able to export oil and gas undisturbed face the smallest headwinds, whereas producers whose own facilities or routes are hit bear much more of the shock. Cross-border households add another layer: a salary in dirhams or riyals, a tuition bill in sterling, and a savings pot in dollars do not inflate at the same rate. Mapping those layers belongs in The Cross-Border Money System; the point here is that a GCC energy exporter can still import inflation.
Europe
Europe is less dependent on Hormuz LNG than Asia, but it is not insulated. The IEA puts Europe’s share of Hormuz LNG inflows at about 7% of its total LNG in 2025. The IMF has grouped large energy importers in Asia and Europe together as bearing higher fuel and input costs.
Higher energy prices can reopen the inflation-and-growth tension that European central banks spent years trying to close. If inflation persists, policy rates may stay higher for longer; if growth slows first, the trade-off becomes sharper. Households feel it in heating, transport and food. Firms feel it in working capital and delayed investment.
Asia
Asia is the primary destination of Hormuz oil and LNG. About 80% of the oil and almost 90% of the LNG that used the strait in 2025 headed east. For Bangladesh, India and Pakistan, LNG through Hormuz was not a marginal cargo but close to two-thirds of supply. Manufacturing, aviation and logistics sit downstream of diesel and jet fuel.
Currency effects can dominate the household result. An oil bill priced in dollars becomes heavier if the local currency weakens at the same time. Energy-producing Asian economies can see a terms-of-trade gain even as consumers pay more at the pump. Energy-importing manufacturers can face the reverse: higher input costs and weaker external demand.
Latin America
Latin America is not one market. The IMF’s April 2026 Western Hemisphere analysis is explicit: oil producers such as Argentina, Brazil, Colombia, Ecuador, Guyana, Trinidad and Tobago and Venezuela can see stronger export receipts and public finances from higher energy prices, while energy and food importers—especially tourism-dependent Caribbean economies and much of Central America—face weaker activity. Caribbean net energy imports average around 6% of GDP. Even in exporting countries, the IMF notes, vulnerable households still pay more for fuel and food. Inflation, the Fund argues, is the more uniform effect: higher for all, even where growth outcomes diverge.
Countries already running high inflation or high policy rates have less room to cushion a new shock. Fuel subsidies can delay the household hit and enlarge the fiscal one. Weaker currencies raise the local-currency cost of dollar-priced oil. Stronger policy frameworks reduce pass-through; they do not eliminate it.
What “money losing value” actually means
Three different losses are often described as if they were one.
Purchasing-power decline is inflation: the same cash buys less of the household’s actual basket. Currency depreciation is a cross-rate change: a riyal, peso or rupee buys fewer dollars, and therefore fewer dollar-priced goods. Asset-price decline is a market move: the listed value of a bond, share or property falls.
They can arrive together. They are not the same.
A short illustration, not a forecast: suppose a household holds 100,000 units of local cash. Consumer prices rise 8%. The local currency falls 6% against the dollar. The cash balance is still 100,000. Its domestic purchasing power is lower. Its external purchasing power is lower still. A nominal asset that “held its value” did not hold its command over goods.
A compact approximation is:
Approximate real return ≈ nominal return − inflation
Tax, compounding, fees and the household’s actual spending mix all change the exact result. The formula is a compass, not a spreadsheet.
The strategic problem
Inflation defence is not a bet on the next oil print, and it is not a search for one asset that always rises. It is the construction of an asset system in which different holdings perform different economic jobs.
Several common habits look prudent until inflation stays high.
Holding large long-term cash balances preserves a number and a sense of safety. It does not preserve purchasing power if prices keep rising. Treating gold as a complete portfolio confuses a crisis diversifier with a growth engine. Treating Bitcoin as a proven safe haven goes beyond the evidence already discussed in When the Gulf Feels Less Secure: portability is not price stability. Owning several funds that all depend on the same growth-and-liquidity regime is not diversification. Chasing last quarter’s inflation winner is usually a purchase after the move. Building a mix without asking which currency the future bill is in leaves a cross-border household half-mapped.
This article does not prescribe allocation percentages. Those depend on liabilities, residency, legal constraints and time horizon—questions no general article can answer.
A five-role asset strategy
Think in roles, not products. The table below is an educational map, not a recommended portfolio and not a set of weights.
| Role | Examples commonly considered | Main limitation |
|---|---|---|
| Stability | Cash and short-duration high-quality instruments | Can preserve a number while losing purchasing power |
| Inflation sensitivity | Inflation-linked securities where available; some commodities or commodity-linked instruments | No perfect match to a household basket; liquidity and tax design vary |
| Productive growth | Broad diversified equities; infrastructure or productive property for some households | Sharp drawdowns; concentration in one country or sector |
| Currency / geographic diversification | Multi-currency deposits, foreign-currency bonds, or assets in the country of a future obligation | Cannot cancel inflation in every location at once |
| Alternative diversification | Gold; carefully limited other alternatives. Bitcoin is high-volatility and not a proven gold equivalent | A satellite role, not a complete asset strategy; no cash flow from gold |
Educational framework only. Not a recommended portfolio and not a set of allocation percentages.
Stability addresses panic and near-term bills. Cash and short-duration high-quality instruments are the usual examples. They cannot guarantee real value after inflation. Quiet erosion is the main risk. The horizon is short.
Inflation sensitivity addresses purchasing-power drift. Inflation-linked securities where they exist, and some commodities or commodity-linked instruments, are commonly considered. They cannot guarantee a perfect match to any household’s basket. Index design, liquidity and tax treatment are the usual traps. The horizon is medium.
Productive long-term growth addresses the fact that inflation is also a story about firms raising prices. Broad, diversified equities and, for some households, infrastructure or productive property are the typical claims on real activity. They cannot prevent sharp drawdowns. Concentration in one country or sector is the main risk. The horizon is long.
Currency and geographic diversification addresses the mismatch between where money is earned and where it will be spent. Multi-currency deposits, foreign-currency bonds, or assets located in the country of a future obligation are common tools. They cannot cancel inflation in every location at once. The horizon matches the obligation.
Alternative or non-traditional diversification is the residual role sometimes assigned to gold, certain real assets, or a carefully limited sleeve of other alternatives. Gold has a long record as a crisis diversifier; it produces no cash flow. Bitcoin offers portability and a scarcity narrative, with high volatility, a short and evolving history, and no status as a proven gold-equivalent safe haven. Neither replaces a complete asset strategy.
Daily liquidity still matters, but it is a foundation rather than this article’s subject. Size the cash layer first; then ask what the rest of the structure is for.
The questions that should change
Replace “What will oil do next?”, “Is gold going up?”, “Should I buy Bitcoin now?” and “Which asset wins inflation?” with questions that inspect the structure itself.
Which risks dominate the current mix—inflation, currency, drawdown, or concentration? Which holdings preserve a nominal number but may lose real value? Which parts depend on one country, one currency or one economic scenario? Which assets provide productive growth? Which holdings look diversified but would fall together if energy, inflation and liquidity tightened at once? What time horizon does each holding actually serve? Which assumptions—cheap energy, fading inflation, reliable chokepoints—were built in when the mix was assembled?
Those questions create momentum. They are not a personal financial questionnaire and they do not produce a buy list.
The Real Question Is Not Where Oil Goes Next
The disruption in the Strait of Hormuz may begin with ships, energy supplies and oil prices, but its consequences do not remain in the energy market. They can travel through transport, manufacturing, food, interest rates and currencies until they reach the purchasing power of ordinary savings.
No one can know with certainty how long the disruption will last, how far oil prices will move or which market will perform best next. That is not the most useful question for a long-term investor.
The more important question is whether an asset structure built for yesterday’s conditions is prepared for a world in which inflation may remain more persistent, energy and trade routes are increasingly vulnerable, and the real value of money cannot be taken for granted.
Holding cash preserves a number on an account, but not necessarily its future purchasing power. Gold may provide one form of protection, but it does not generate productive growth. Equities may participate in long-term economic expansion, but they can fall sharply when markets are under pressure. Property, bonds and alternative assets each respond differently to inflation, interest rates, currencies and geopolitical risk.
The answer, therefore, is unlikely to be one perfect asset.
It is a more deliberate structure in which different assets perform different jobs: some preserve stability, some respond to inflation, some generate long-term growth, and some provide diversification when traditional markets are under strain.
The Strait of Hormuz is the immediate event. The deeper issue is whether your wealth is structured to preserve real value when the economic environment changes.
This is the moment to look beyond the next oil-price headline and ask:
“If inflation remains higher for longer, which parts of my asset structure will defend purchasing power—and which parts are still relying on the value of money remaining stable?”
That question does not require an immediate investment decision. But it should create the momentum to review assumptions, reconsider concentration and begin designing a more inflation-resilient long-term asset strategy.
Educational disclaimer
This article is for financial education only. It does not provide individualized investment, legal or tax advice. Cross Border Money Lab is not a licensed financial adviser, investment manager or financial institution. Asset prices can fall. Rules, product terms and shipping conditions change. Check the original source, and a qualified professional where a decision is high-stakes.
Related Cross Border Money Lab articles
- The Cross-Border Money System — maps cash, transfers, records and longer-term layers before any asset mix.
- When the Gulf Feels Less Secure: Gold, Bitcoin and the New Search for Financial Safety — why gold and Bitcoin play different roles, and why neither replaces accessible money or a clear structure.
Upcoming: How Much Emergency Cash Should an Expat Keep? and The True Cost of Sending Money Across Borders.
Sources and further reading
- IEA: Strait of Hormuz — 2025 oil, LNG and bypass-capacity figures; last updated February 2026.
- IEA: Strait of Hormuz 2026 factsheet (PDF)
- IEA: The Middle East and Global Energy Markets — conflict impact, fertiliser and aluminium exposure, and the 11 March 2026 stock release.
- IEA: How global oil supplies have readjusted after the Hormuz shock
- IMF: How the War in the Middle East Is Affecting Energy, Trade, and Finance — 30 March 2026.
- IMF: The Middle East War Will Have an Uneven Impact on the Western Hemisphere — 17 April 2026.
- IMF: How the Middle East War Has Affected Oil Exporters and Importers — 22 April 2026.
- World Bank: Commodity Markets Outlook, April 2026, press release — 28 April 2026.
- World Bank: Commodity Markets Outlook, April 2026, executive summary
- UNCTAD: Strait of Hormuz Disruptions — the burden of oil price shocks on vulnerable economies — 2 June 2026.
- UNCTAD: Vulnerable economies face the heaviest burden of oil shocks
- Reuters: Vessels trickle through the Strait of Hormuz as Middle East tension persists — 21 September 2026.
Factual review: 22 September 2026.
 Cross Border Money Lab