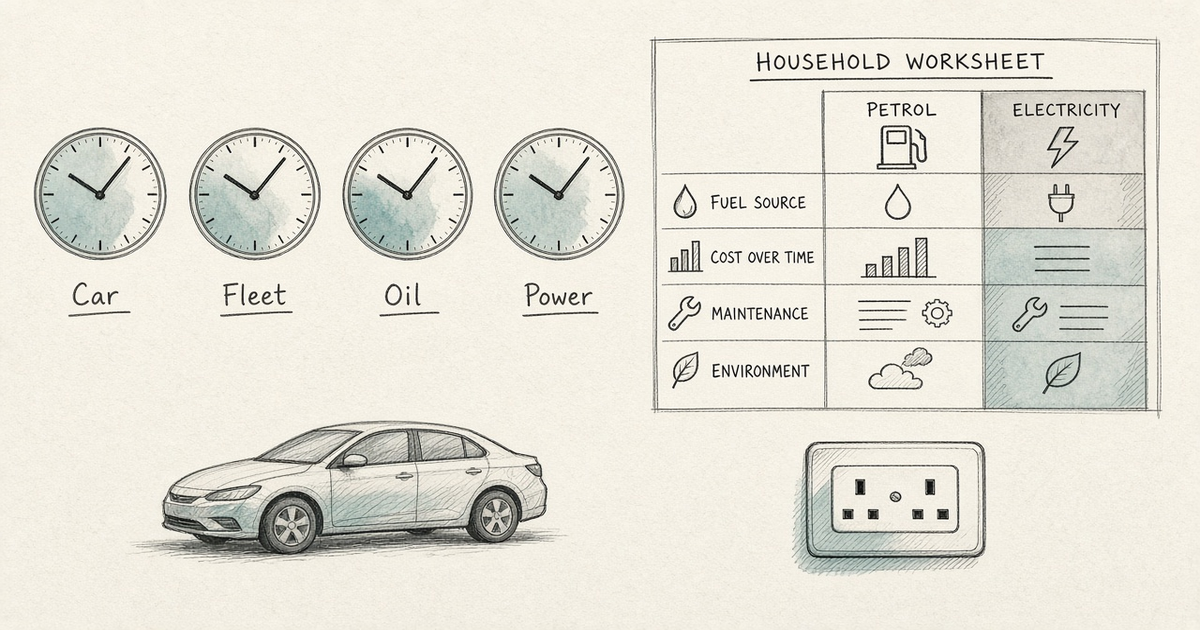
New-car sales can shift before the fleet, oil demand or the power system does. A household vehicle choice is not a trade on that shift.
Why This Matters
Gulf News, updated on 6 October 2026, reported that petrol-only vehicles accounted for 49% of new-car sales worldwide in the first half of 2026, citing Mobility Global data first reported by Nikkei. It described that share as the first time on the record used in that reporting that gasoline-only models had slipped under half of the global new-car market, down from 73% in 2021.[1]
That is a new-sales figure. It is not the share of cars already on the road. It is not a GCC household’s running-cost sheet. It is not a signal to buy or sell oil, an energy stock, or a carmaker.
Battery-electric vehicles (BEVs) run on a battery and have no engine. Hybrids (HEVs) still use an engine, with electric assistance, and typically cannot plug in. Plug-in hybrids (PHEVs) can plug in and still use an engine. Those three are not the same product. A headline that folds them together as “EVs” can make the oil system look more electrified than the fleet actually is.
After reading this article, the reader will understand that global new-car sales, the vehicles already on the road, oil demand and electricity demand move on different clocks, and will be able to check a household vehicle choice against commute, charging, cash timing and local energy prices without treating that choice as a trade on oil.
Key Points
- The 49% petrol-only figure is attributed to Mobility Global via Nikkei, as reported by Gulf News on 6 October 2026. CBML has not independently audited the underlying dataset.
- It applies to new cars sold, not to the stock of vehicles already driven.
- Only a BEV runs with no fuel. Hybrids and PHEVs still consume petrol or diesel.
- Electricity demand is already rising for reasons that include vehicles, cooling, industry and data centres. A BEV moves cost from the pump toward the meter. It does not delete the energy bill.
- A personal replacement decision is not a position on oil prices, OPEC policy, or automaker shares.
- This article does not publish unverified GCC petrol or electricity tariffs. Look up the tariff that actually applies to the meter and the pump you use.
AUDIO INSIGHT BRIEFING
Listen to the key implications in under three minutes (2:24).
READ THE FULL ANALYSIS BELOW ??/p>
What the 49% Figure Is, and What It Is Not
Gulf News summarised first-half 2026 global new-car sales as about 20.25 million gasoline-only units, 10% lower than a year earlier, with a 49% share. It also reported hybrid sales of 7.27 million (18%) and BEV sales of 6.87 million (17%), with diesel, PHEV and other powertrains making up the remainder in that write-up.[1]
CBML is not reproducing a full secondary powertrain table as if it were a primary census. The original Mobility Global / Nikkei methodology was not independently retrieved in this verification pass. Secondary write-ups have also discussed definitional limits, including which vehicle classes sit inside “cars.” Those limits are not resolved here. Use 49% as an attributed sales-mix marker, with that caveat attached.
Even on the figures as reported, most new vehicles sold in the first half still had an engine. A BEV share near 17% of new sales is not 17% of the world’s cars. Stocks turn over slowly. Households buy infrequently. Company fleets and taxis turn over faster. Aviation and shipping, which the International Energy Agency notes are hard to electrify, sit outside this car-sales story altogether.[2]
The IEA’s Electrification special report, published 22 September 2026, put electric vehicles at nearly 25% of new car sales in 2025, up from less than 1% in 2015, while electricity’s share of transport energy consumption was still only nearly 2% in 2025. The same report said an electric vehicle is typically two to four times more efficient than an internal-combustion one at converting energy into movement.[2]
Those statements can sit together. New-sales shares can look dramatic while transport energy is still mostly oil, because the fleet is large and slow.
The IEA’s Global EV Outlook 2026 executive summary said electric car sales exceeded 20 million in 2025, about one-quarter of new cars, and that the global EV fleet avoided around 1.7 million barrels of oil per day that year, mainly in countries with fuel-economy and CO₂ standards such as China and the European Union. It also published 2026 outlook figures, including expected sales of 23 million electric cars, about 28% of total car sales. Those 2026 numbers are an IEA outlook, not a counted year.[3]
Do not collapse 2025 counted sales, a 2026 first-half attributed mix, and a 2026 full-year outlook into one “EVs have taken over” sentence.
Four Clocks, Not One Market
Clock 1: new-car sales. This is where 49% petrol-only lives. It can move in a few quarters when fuel prices, subsidies, regulation or model pricing change.
Clock 2: the fleet. Cars already bought keep burning fuel, or drawing power, for years. A sales mix is a flow. The fleet is a stock. GCC households that keep a petrol car for another five years are on this clock, whatever happened in global H1 showrooms.
Clock 3: oil demand. Road transport is a large slice of oil use. The IEA has said it represents close to half of oil demand today.[3] That still leaves aviation, shipping, petrochemicals and other uses. A change in new-car mix does not immediately reprice a barrel, and this article is not a price forecast.
Clock 4: electricity demand and the grid. If more BEVs are charged, more kilowatt-hours have to be generated, moved and paid for. The IEA’s Electricity Mid-Year Update 2026 is the latest electricity outlook used here. It forecasts global electricity demand growth of 3.6% in 2026 and 3.8% in 2027, up from 3% in 2025, with structural drivers including industry, appliances, electric vehicles, air conditioning, heat pumps and data centres. It also stresses grids, flexibility and the mix of generation, and it treats 2026–27 figures as forecasts.[4]
A household that switches from petrol to a BEV has not left the energy system. It has changed which bill, which infrastructure, and which reliability risk it sits on.
The UAE’s Barakah plant is a local illustration of electricity supply, not a requirement that every EV needs nuclear power. The Emirates Nuclear Energy Company states that four units currently generate 25% of the UAE’s electricity needs.[5] That is a UAE generation fact. It does not tell a Doha or Riyadh household what their night-time charging will cost, and it does not mean a BEV is only viable where a nuclear plant exists. Renewables, gas and grid imports all sit in regional power systems. This article does not assign a kilowatt-hour in your building to a named plant.
How the Shift Reaches a GCC Household
The path is practical, not cinematic.
Pump versus meter. A BEV replaces most or all petrol with electricity for that vehicle. The saving, if any, depends on the tariff you actually pay, when you charge, and how far you drive. A hybrid still buys petrol. A PHEV’s result depends on how often it is plugged in. CBML is not inserting made-up fils-per-kWh or pump prices. Those differ by country, emirate or city, and they change. Read the last bill and the last fill.
Up-front cash versus running cash. A cheaper year of energy can sit behind a larger purchase, a loan, insurance, tyres and, for some BEVs, questions about residual value that this article will not pretend to price. Annual affordability and a down-payment date are different problems. Nominal fuel savings become extra money that could be saved or invested only after the purchase, insurance and charging are paid. Even then, that leftover is not an instruction to buy a fund, a stock or a property.
Charging access. A building parking bay with a socket is a different life from street parking and public chargers. Commute length, summer heat and whether a second car remains petrol all change the result. None of that is captured in a global 49% figure.
Administered fuel prices. In parts of the GCC, pump prices are not a free daily market. A global oil move and a local fill can diverge. That is one reason a household should not treat an EV purchase as an oil-market hedge.
Fleet versus family car. Delivery vans, taxis and company cars clock more kilometres. Running-cost arithmetic is often clearer there. A family car that sits in a compound all week is a weaker case for copying a fleet spreadsheet.
The IEA still hosts a Total Cost of Ownership comparison tool. The public page for that tool is dated 13 December 2022.[6] It is a method reminder: compare purchase, energy, maintenance and holding period together. It is not a 2026 GCC price list. Do not drop 2022 tool outputs into this year’s household decision as if they were local quotes.
Personal Choice Is Not a Trade
The financial ending that follows from this evidence is specific.
A headline about petrol-only cars losing a majority of new global sales is not a signal that oil demand has already halved. It is not a signal that GCC export revenue has a dated peak in this article. It is not a buy or sell instruction on energy companies, carmakers, battery firms or currencies.
If you replace a household car, you are choosing a depreciation schedule, an energy bill, and a charging constraint. You are not taking a position in the oil market. If someone is selling the 49% figure as if it were that position, they are mixing Clock 1 with Clock 3.
Labelled hypothetical, not a quote: a driver who does 40 kilometres a day, charges at home, and can wait for a public charger at weekends is in a different worksheet from a driver who cannot park off-street and does long highway trips with passengers and bags. The global mix does not decide which worksheet you are on.
Another labelled limit: this article does not infer listed-company profits, dealership margins, or property values near charging sites from the sales-mix report. There is no verified market price attached to this update. It is not a trade.
A Practical Comparison, Without Fake Tariffs
Use four lines. Fill them with documents you already have or can request. Leave blanks. Do not invent the missing number.
- What you are replacing. Petrol, hybrid, PHEV or BEV; years you expect to keep it; whether a second car remains.
- Energy, from actual prices. Last petrol fill and last electricity bill, plus whether charging would be at home, at work, or at public points. If the tariff is unknown, stop. Do not use a regional average from memory.
- Cash timing. Down payment or balloon; insurance; any employer car scheme; the month the old car is sold. A lower running cost that starts after a large outflow is not the same as spare cash this quarter.
- Failure modes. Charger down; summer range; a posting that moves you to a building without parking power; residual-value uncertainty. Write them as conditions, not as forecasts.
If line 2 is blank, the 49% headline has not yet become a household calculation. That is a valid stopping point.
Company fleets can add utilisation and depot charging. Households should not copy a depot model onto a compound parking bay.
Takeaways
The attributed 49% petrol-only share of global new-car sales in the first half of 2026 is a Clock-1 fact with a methodological caveat. Electricity’s rise, including from vehicles, is a Clock-4 story that the IEA’s 2026 mid-year electricity update treats as ongoing demand growth plus grid and mix questions. Oil demand and the vehicle stock sit in between.
A GCC household can take the shift seriously without treating a car purchase as energy-market exposure. Compare the vehicle you would actually use, at the prices you would actually pay. Do not wait for a single global percentage to tell you what to do, and do not let it talk you into a trade it does not support.
What to Watch Next
- Whether later 2026 counted data, from official registries or a retrieved primary dataset, confirm, revise or qualify the 49% attributed mix.
- IEA electricity updates versus realized demand, especially comments on grids, flexibility and price spikes, not only headline terawatt-hours.
- Official GCC or national new-car mix figures, if published, kept separate from the global number.
- Changes to the petrol price you actually pay and the electricity tariff on your meter, including time-of-use if it exists.
- Charging access in the building or workplace you actually use, which will move a household decision faster than a global sales share.
- Any claim that a personal BEV is a hedge on oil. Treat that as a category error unless a specific, documented instrument is being discussed — which this article does not recommend.
Educational note
This article is for general information and education. It is not personalised investment, vehicle-purchase or tax advice, and it is not a forecast of oil prices, electricity tariffs, residual values or company performance.
Sources
- Gulf News, Jay Hilotin, “Petrol-only cars fall below 50% of global new-vehicle sales for first time,” last updated 6 October 2026, 03:08. Figures attributed to Mobility Global via Nikkei; Electrek cited for additional colour. Original dataset not independently audited in this pass.
- International Energy Agency, Electrification special report, published 22 September 2026. Electricity about 23% of final energy in 2025; EVs nearly 25% of new car sales in 2025; electricity nearly 2% of transport energy in 2025; EV typically two-to-four times more efficient than an internal-combustion vehicle; aviation and shipping noted as hard to electrify.
- International Energy Agency, Global EV Outlook 2026, executive summary. Electric car sales exceeded 20 million in 2025 (about one-quarter of new cars); about 1.7 million barrels a day of oil use avoided in 2025; 2026 outlook includes about 23 million electric-car sales (about 28%). Outlook figures are not counted-year results.
- International Energy Agency, Electricity Mid-Year Update 2026, executive summary. Demand growth forecast 3.6% in 2026 and 3.8% in 2027, from 3% in 2025, with EVs among several structural drivers; grids and flexibility stressed; 2026–27 figures are forecasts. This is the latest IEA electricity outlook used in this article, not an older annual electricity report.
- Emirates Nuclear Energy Company, “Overview,” accessed 6 October 2026. Four units at Barakah; currently generates 25% of the UAE’s electricity needs. Used as a UAE supply illustration, not as a requirement that EVs need nuclear power.
- International Energy Agency, Total Cost of Ownership comparison tool page, dated 13 December 2022. Cited only as a dated method reminder, not as 2026 GCC prices.

